All diagrams in overview and genetic evidence
Large scale brain networks
Connectivity measures describe relationships in recorded brain activity. Dashed lines show statistical dependence, not axons or proven causal influence.
Large scale brain networks
Evidence interpretation
Open larger diagram · Full-size PNG · Diagram page
Read the diagram explanation and sources
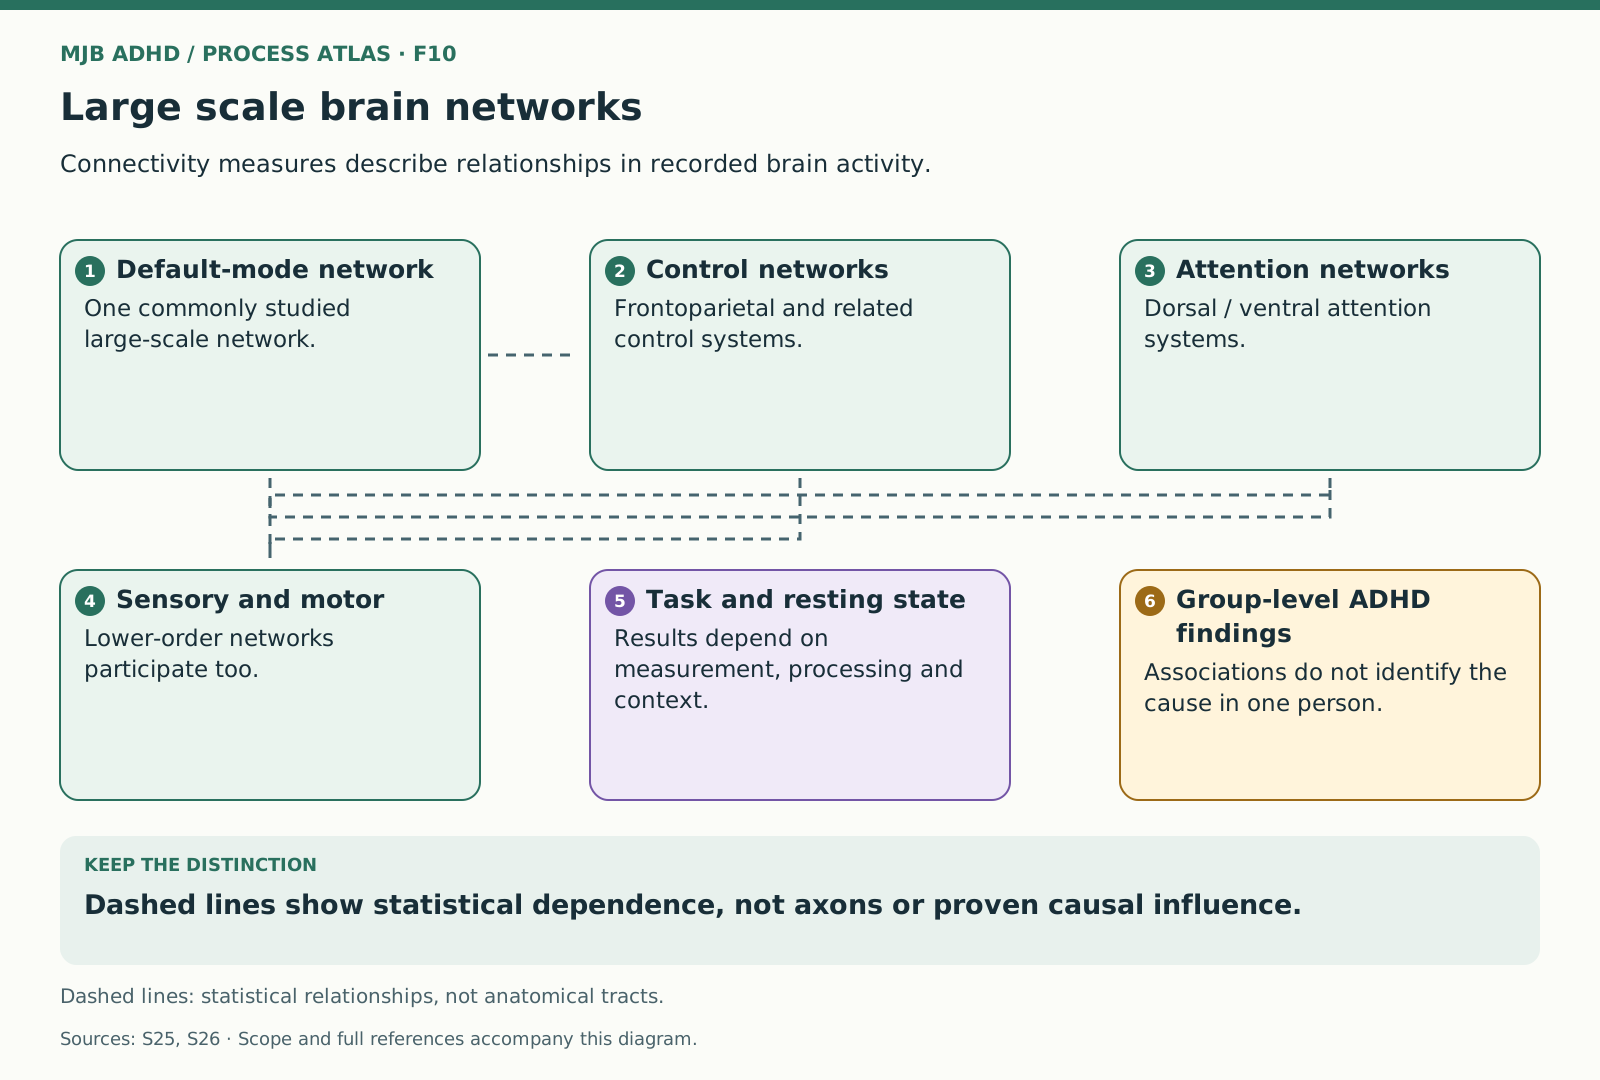
Functional connectivity quantifies statistical relationships between measured signals. It is distinct from an anatomical tract and from a demonstrated causal effect. ADHD studies examine group-level relationships among default-mode, attention, control and other networks; results vary with age, sample, task, motion and analysis. The network layout is conceptual, not a coordinate map or a faithful reproduction of a particular study result. Neither connectivity nor one network measure supplies a stand-alone diagnosis.
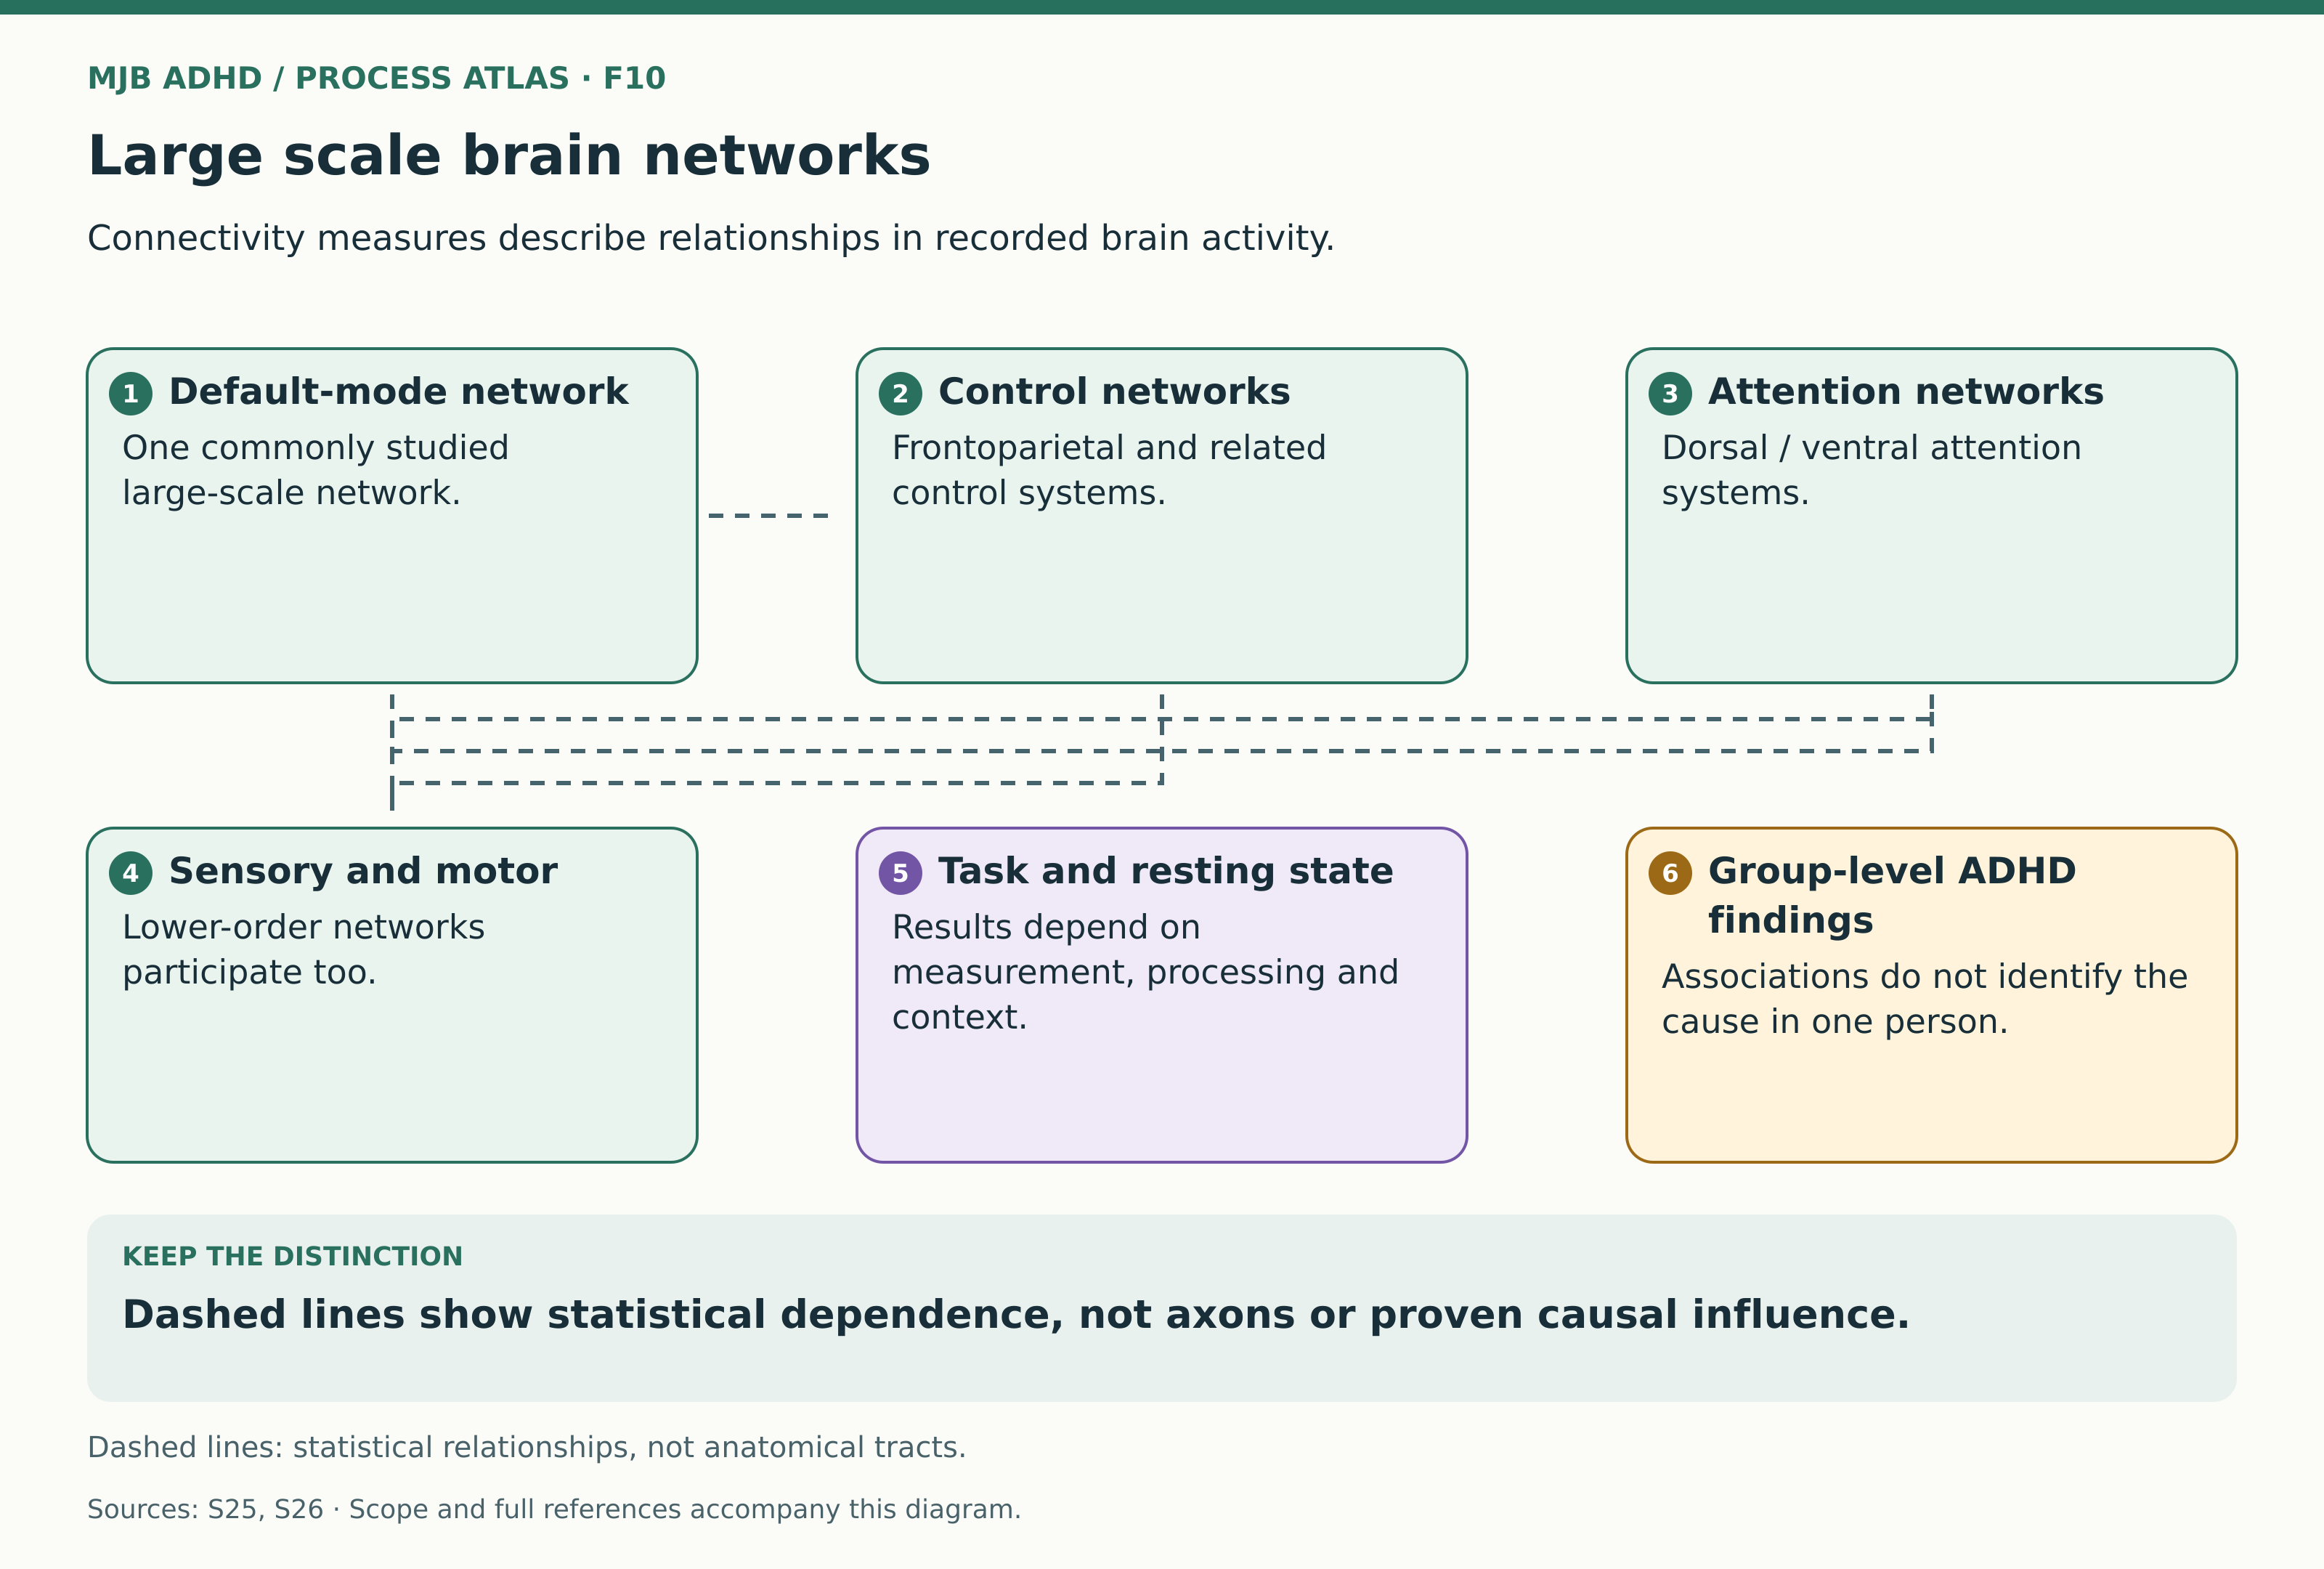
- Default-mode network → Control networks: statistical relation
- Default-mode network → Attention networks: statistical relation
- Control networks → Sensory and motor: statistical relation
- Attention networks → Sensory and motor: statistical relation
What the diagram shows
Functional connectivity quantifies statistical relationships between measured signals. It is distinct from an anatomical tract and from a demonstrated causal effect. ADHD studies examine group-level relationships among default-mode, attention, control and other networks; results vary with age, sample, task, motion and analysis. The network layout is conceptual, not a coordinate map or a faithful reproduction of a particular study result. Neither connectivity nor one network measure supplies a stand-alone diagnosis.